1. COVID-19 Infection Risk Maps
This tool identifies the Infection Risk of COVID-19 for Portugal mainland as well as uncertainty attached to the risk. The method is based on the number of new daily infections per municipality as reported by the Portuguese Directorate-General for Health (DGS).
This tool was developed by a team of researchers (see 4) from CERENA – Centro de Recursos Naturais e Ambiente of Instituto Superior Técnico – specialists in Geostatistics and Spatial Data Sciences with substantial experience in projects concerning Environmental Epidemiology.
The risk maps shown here can be used by public health officials to identify local risk areas related to daily rates of infection – the number of new infections per 10000 inhabitants of a given municipality within a 24-hour period – and to guide surveillance and control activities.
COVID-19 contamination risk is evaluated using a stochastic spatial dispersion model of observed infection rates (more details about the model). The model takes into account reported infection rates by municipality, spatial patterns of contamination, and attached uncertainty resulting from noise/uncertainty related to the dimension of each municipal population. This is an adapted and improved version of an existing model applied to a previous CERENA project.
2. Infection Risk and Uncertainty Maps in a web-based GIS Platform
An interactive GIS-based tool is provided below to visualize the infection risk and uncertainty maps (See further description on Section 3). These are organized by day in reverse chronological order. Users may select different maps using the arrow at the top left corner. Under legend, different layers corresponding to the infection risk and uncertainty maps (difference between Q75 and Q25) are available. The color scale can be visualized using the arrow in front of the map name.
Important remarks:
Analysis of infection risk values must always be complemented by the interpretation of uncertainty values. A high risk of infection in a municipality with a small population is always associated with high uncertainty. Hence, the risk value at that location has little relevance.
Infected values per municipality below the limit of 3 are not reported by the DGS. In this model, a minimum value of 2 infected was adopted for all unreported municipalities. The effect of this threshold value in municipalities with small population can lead to high infection rates and high values on risk maps. Nevertheless, high uncertainty is an inherent feature of the present case. This is the case, for example, for some municipalities on the eastern border of Portugal (Barrancos, Castelo de Vide).
Disclaimer: despite the high-resolution nature of the map, the zoom capability below the scale 1:15000m has been disabled. Azores and Madeira are not considered as the number of infected is too low for the statistical model.
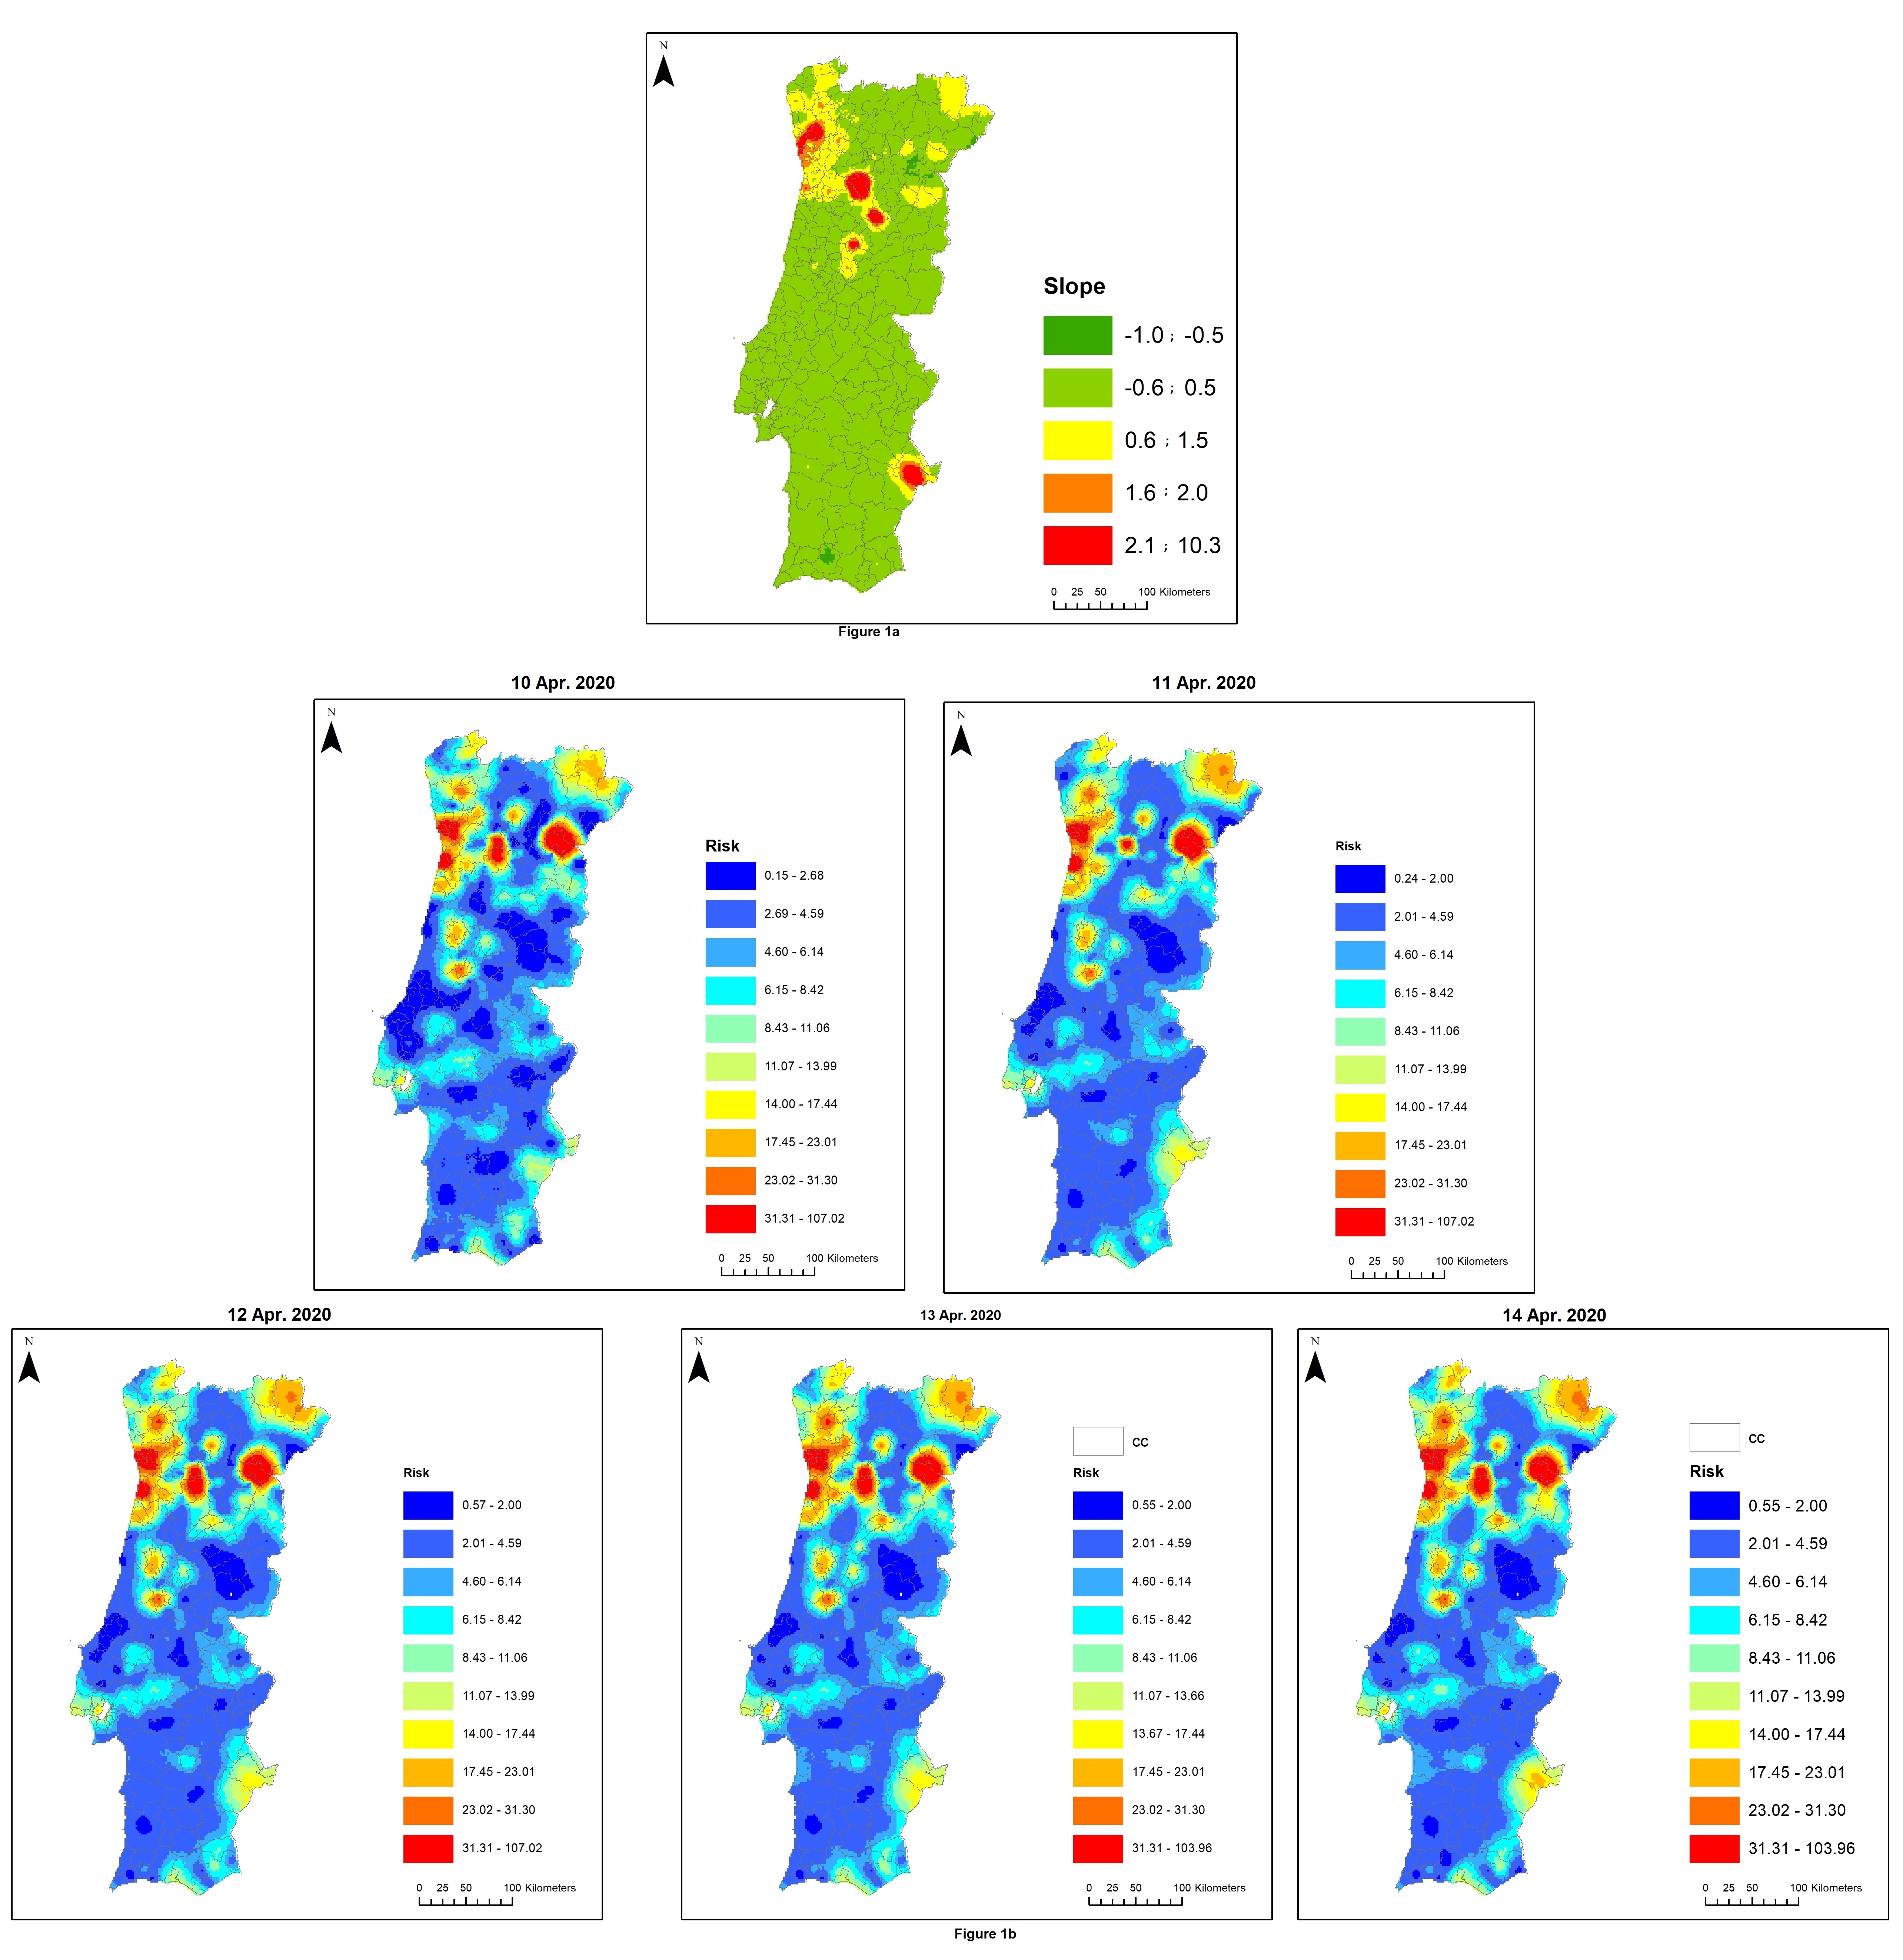
The resulting ensemble of risk maps, covering a past period of several days or weeks, may reveal a temporal trend in the prevalence of infection. Assuming the linear behavior of infection risk over a short period (for example, the 5 days in Fig. 1a), the slope of a linear regression is used as an indicator of the direction and intensity of the temporal trend of risk (Fig. 1b). The slope value in the legend indicates the increase and stability of decrease of risk on each day: slope=1 means an increase of 1 infected/10000 inhabitants, per day; slope ≈ 0 indicates no significant changes; slope = -1 means a decrease of 1 infect/10000 inhabitants.
3. Infection Risk and Uncertainty Maps
Results are presented as high-resolution maps of local averages of infection risk, as well as a measure of the uncertainty attached to these local averages. Fig 2a shows the geographical location of municipality centroids of recorded infection rates; Fig 2b presents the local expected risk maps for the entire country on April 3, 2020.
As evaluated using these simulated realizations, the risk’s uncertainty is related to population by municipality: infection rates reported for municipalities with small populations are more uncertain than the equivalent rates for municipalities with large populations. Fig 2c shows the uncertainty of risk maps for the entire country, also on April 3, 2020.
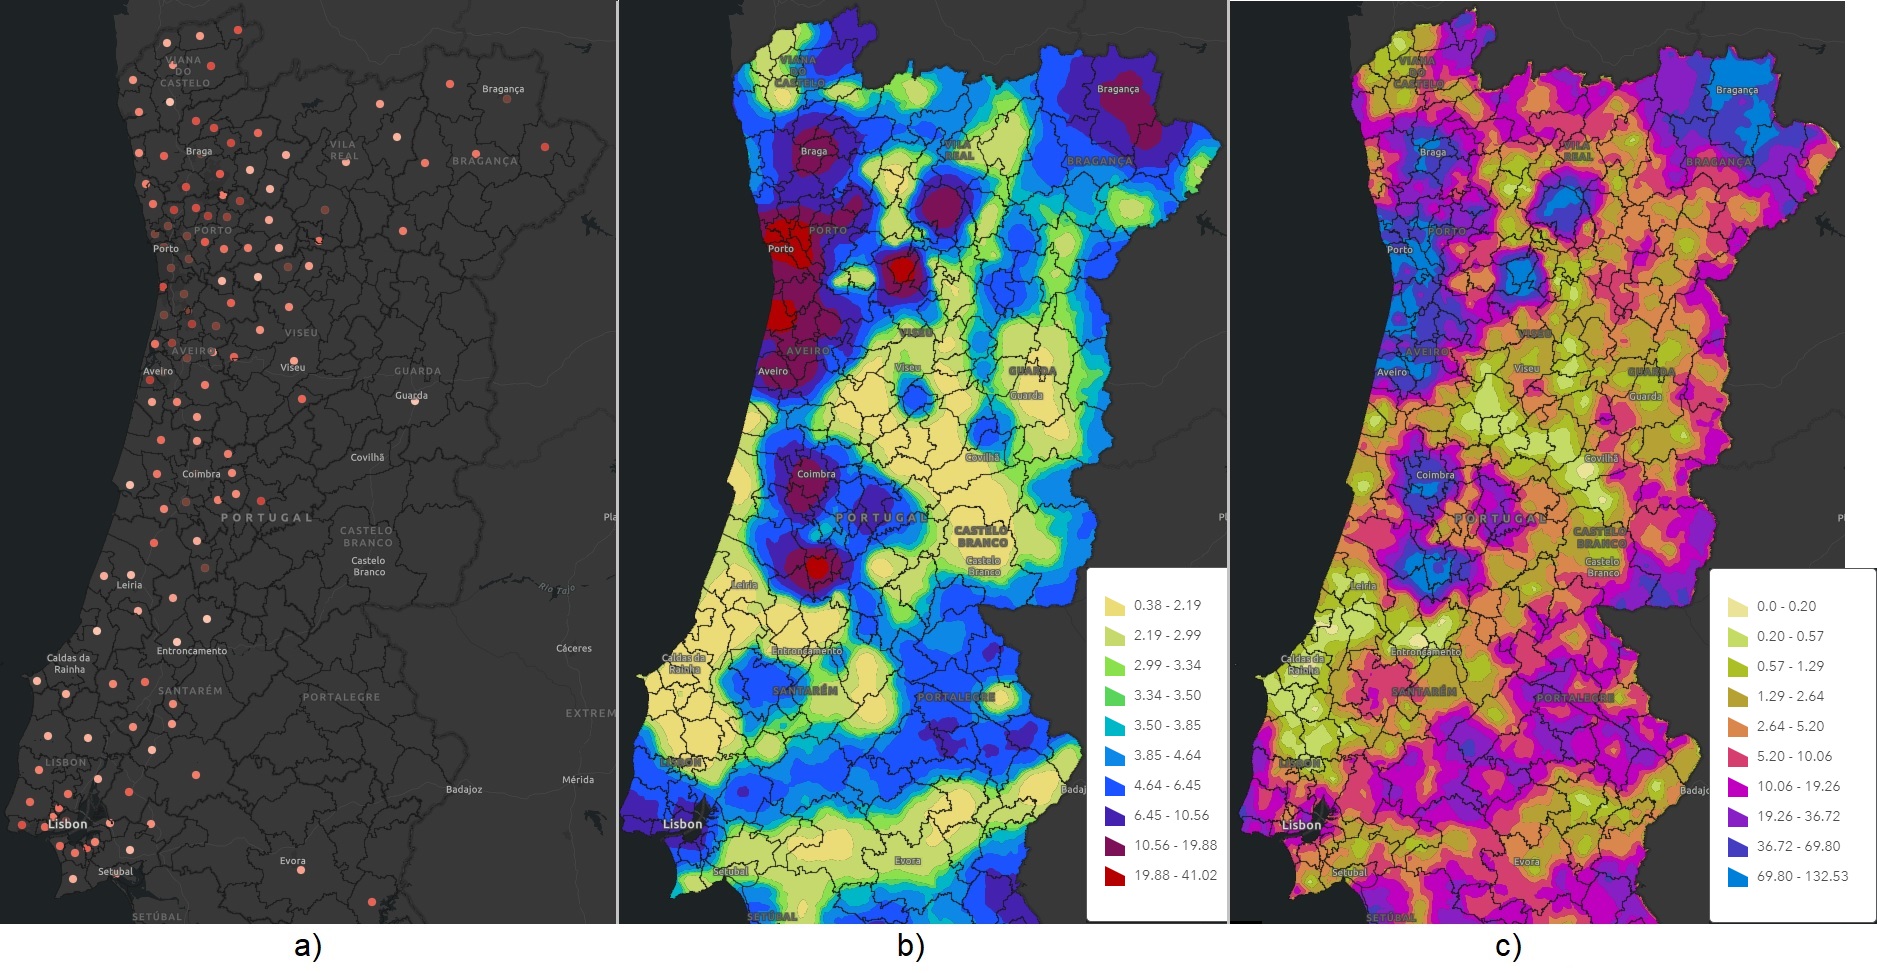
Figure 2
4. The team of CERENA involved in this study
CERENA is involved in several Environmental Epidemiology projects which has resulted in more than 40 publications ISI in Environmental Epidemiology and 60 publications ISI in Environmental factors associated with health indicators.
This is the team involved in this study:

|
Amílcar Soares (asoares[at]tecnico.ulisboa.pt), is Full Professor at the Instituto Superior Técnico (University of Lisbon) and Visiting Professor at some other schools at UAE, Australia and Brasil. He was Distinguished Lecturer of International Association of Mathematical Geosciences. His recent R&D work is focused on integration of geostatistics with spatial data sciences methods |

|
Leonardo Azevedo (leonardo.azevedo[at]tecnico.ulisboa.pt), is Assistant Professor at the Instituto Superior Técnico (University of Lisbon) and researcher at CERENA. His research is focused on geophysical inverse and spatial modelling with geostatistical tools. Recent work focuses on geophysical modelling for environmental applications. |

|
Manuel Ribeiro (manuel.ribeiro[at]tecnico.ulisboa.pt), is research fellow at CERENA and Invited Assistant Professor at Instituto Superior Técnico (University of Lisbon). His main research interests are focused on spatial and spatio-temporal modelling tools applied to environmental epidemiology. |

|
Maria João Pereira (maria.pereira[at]tecnico.ulisboa.pt), is Full Professor at the Instituto Superior Técnico (University of Lisbon) where she coordinates the research centre CERENA-Centro de Recursos Naturais e Ambiente. Her research interests are the development of geostatistical methodologies for spatio-temporal modeling of physical phenomena and processes, for applications in the area of georesources, environment and health. |
5. Potential and limitations of the tool
The clear managerial and administrative potential of the risk map tool is grounded in the following four possibilities:
i) perception of local dynamics of infection, through a comparison of temporal sequences of historical infection risk maps;
ii) association with other factors that might contribute to infection risk;
iii) visualization and management of main health equipment existing in each risky area;
iv) visualization and management of local high values and attached uncertainty derived from the dimension of the population.
Some limitations of the proposed model should be mentioned:
i) The risk maps are produced based on daily information provided by the Portuguese Department of Public Health. Existing sampling errors of reported infected people in daily reports will be reflected in the maps. However, as the dynamic of the COV 19 risk is obtained by comparing maps from different periods, more reliable measurements can be obtained with large periods of comparison.
ii) When a given rate is reported for a municipality, a spatial stationarity of that rate is assumed for the entire council. Cluster infection data (which can occur, for example, in retirement communities) can eventually bias the infection rate of a council, primarily if the population is small.
Acknowledgements
ESRI Portugal; Evan Morson-Glabik
In the Media
Portugal já tem um mapa de risco de infeção por coronavírus, SIC, 06-04-2020
Portugal tem um “mapa de risco” da covid-19, Público, 09-04-2020
Os mapas da Covid-19 em Portugal, Exame Informática, 09-04-2020
Covid-19. Mapa revela qual o risco de ser infetado no seu concelho, Notícias ao Minuto, 09-04-2020
Qual o risco de infecção por covid-19 no meu concelho?, Público, 13-04-2020
COVID-19: Qual o risco de ser infetado na sua localidade? Veja neste mapa, SAPO, 14-04-2020
Covid-19: Qual é o risco de infeção no seu concelho? Saúde + TV, 20-04-2020
Covid-19: Como aliviar as medidas de contenção? Pode estar aqui a solução, Saúde + TV, 21-04-2020